Observability Foundations for Distributed Workflows
Consider a proposed agent workflow that queues a request, obtains context, calls a model and then invokes a tool. Each stage creates a different measurement question. The operator might need total user-visible duration, time spent waiting for a dependency or the distribution of completed requests within a chosen window. This Research analysis uses that hypothetical workflow to compare telemetry views. It reports no benchmark or executed experiment and makes no claim that every agent architecture has the same sources of variability.
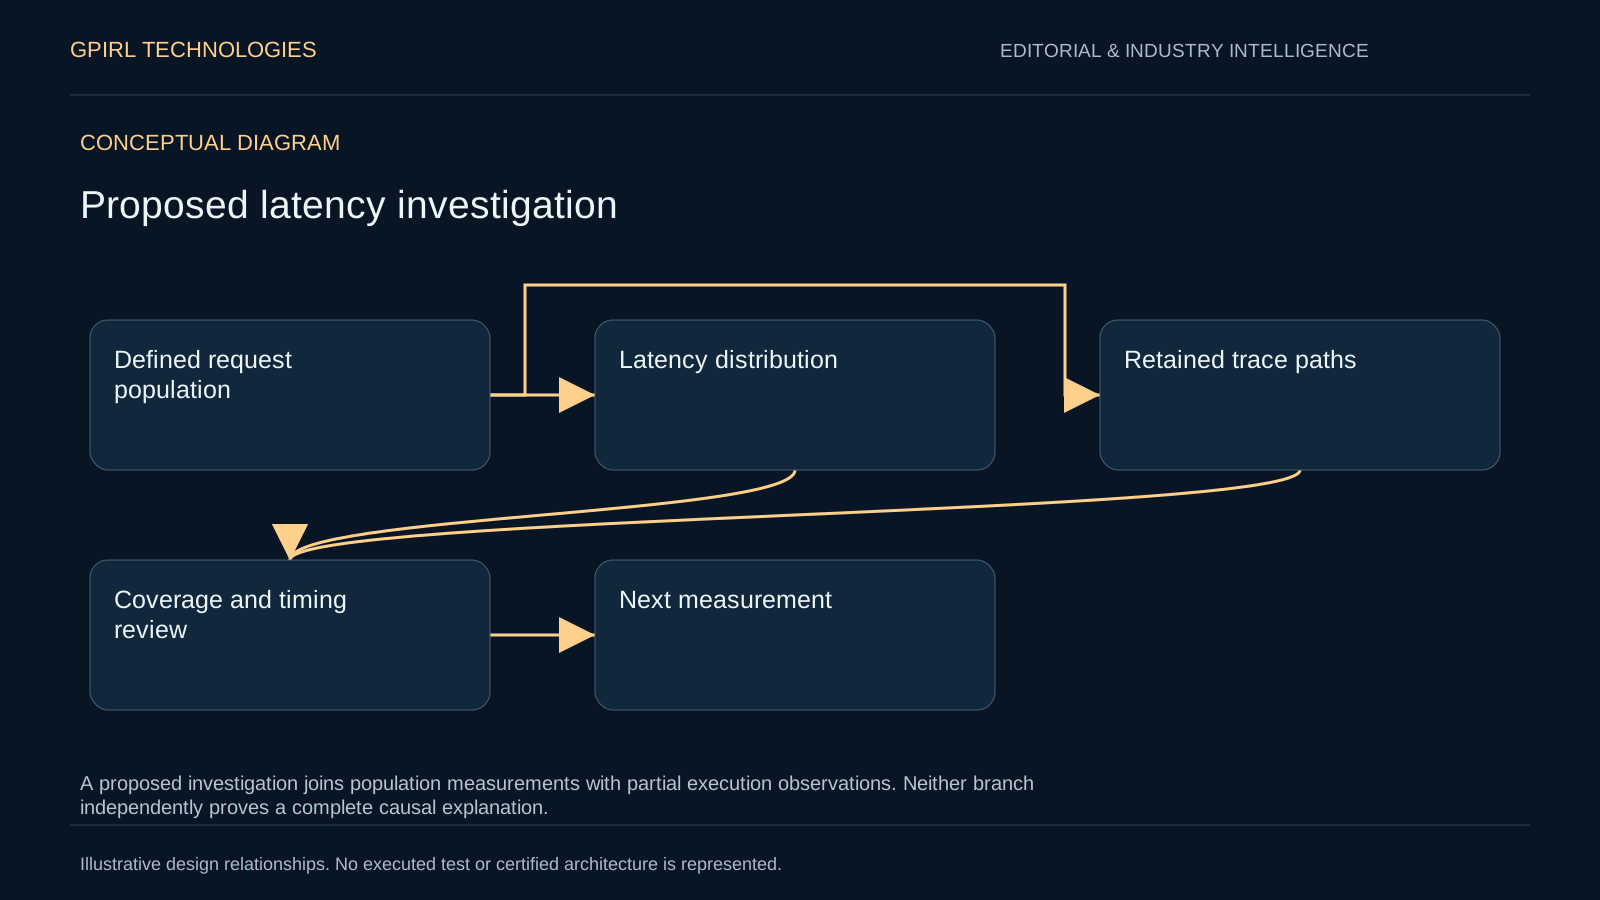
OpenTelemetry describes spans as operations with timing and context, while metrics describe measurements and their aggregation [S1][S2]. These views can inform different parts of an investigation. A distribution can reveal a change in the selected population; a retained trace can expose the operations that were observed during one execution. The proposed investigation would keep those questions explicit. Neither a visually detailed path nor a single percentile should be treated as a complete explanation without checking the coverage and assumptions behind it.
Metrics as Distributions and Histogram Limitations
OpenTelemetry includes instruments such as counters, gauges and histograms. A histogram aggregates observations such as request durations [S2]. Google's monitoring chapter discusses bucketed latency counts as a way to inspect a distribution rather than rely only on its mean [S3]. A proposed dashboard should state how any percentile is derived or estimated from those observations. The display needs a population and time window; the presence of a chart does not by itself configure an alert or establish what condition warrants an operational response.
As a mathematical interpretation, averaging instance p99 values does not recover the p99 of their combined observations. An aggregation review should therefore specify the populations, windows and compatible histogram representation before comparing results. Bucket counts also do not preserve a full individual execution path. That limitation does not make metrics uninformative: labels, counts and concurrent changes can help narrow a hypothesis. The proposed review would state what each retained distribution supports and what additional evidence would be needed to distinguish competing explanations.
Traces as Partial Instrumentation and Causality
A span represents a unit of work and records timing and context. Context propagation enables related spans to be correlated across components when the relevant context is carried [S1]. A recorded parent-child relationship helps organize the observations; it does not independently demonstrate every dependency in the underlying system. For the hypothetical workflow, the team would inspect the instrumentation boundary at each handoff, including work performed before a root span begins or after the traced request has returned to its caller.
This granular mapping allows engineers to reconstruct execution paths of recorded invocations. When an agent calls multiple APIs before generating a response, the trace exposes execution durations for captured spans. However, missing instrumentation and sampling policies may omit slow paths, and trace analysis remains a partial view rather than a guaranteed exact root cause for the failure. [S1]
Sampling Strategies and Trace Loss
Sampling and retention should be recorded as properties of the chosen observation pipeline. This article's proposed study would document the selected policy, its configuration and the points where observations might be dropped. It does not assume that complete collection is impossible or that one sampling approach is appropriate for every volume. A reviewer needs to know whether slow cases were eligible to be observed and whether the collector and storage path preserved the observations needed for the question under investigation.
If a selected tail-sampling policy favors longer traces, that preference should not be reported as guaranteed capture of every slow execution. In the proposed review, buffering limits, late-arriving spans, collection failures and the selected decision rule would all need inspection. Absence from the retained trace set could reflect the workload or the observation pipeline. Without that distinction, a team might interpret an apparent lack of slow traces as a performance result even though it has only established a limit in its evidence.
Correlating Metrics to Traces for Diagnosis
Effective tail latency diagnosis requires a disciplined workflow that bridges metrics and traces. Operators begin by monitoring metric dashboards to detect statistical anomalies in latency distributions across services. Once a latency spike is identified, operators examine exemplar data or query tail-sampled traces filtered by high duration thresholds in dashboards.
A correlation between a latency change and a long dependency span can identify a useful candidate explanation. It does not, by itself, show why the dependency slowed down or exclude an earlier queueing delay. The proposed investigation would compare the timing window, request class and available dependency observations before selecting the next test. If several explanations remain consistent with the evidence, the report should retain them. The purpose of the joined view is to improve the next question, not to replace uncertainty with a confident story.
Proposed Synthetic Jitter Experiment
To evaluate latency under controlled conditions, engineering teams can implement a standardized test harness designed to simulate concurrent multi-tool workflows. This proposed test design injects synthetic requests of varying complexity into the system runtime while recording OpenTelemetry metrics and tail-sampled traces. The proposed experiment introduces controlled network jitter on external tool endpoints to measure system resilience under stress.
No version of the proposed jitter experiment has been executed for this article. The study plan would record its expected observations before running: which delay was introduced, where it should appear, and which measurement could fail to capture it. A later report would need the actual configuration, sample and results before making a performance claim. A failure to see an injected delay would prompt a coverage investigation; it would not automatically establish that the system tolerated the disruption successfully.
Span Causality, Concurrency, and Timing Pitfalls
Consider a deliberately simplified timing illustration in which three branches start together and the parent waits for all of them. Ignoring other work, the longest branch determines that waiting interval. If those assumptions do not hold, the parent duration can also include scheduling, queueing or later processing. The example explains why adding all child durations can overcount elapsed time when operations overlap. A proposed timing review should state which intervals overlap and which remain outside the instrumentation rather than apply the illustration universally.
Furthermore, assuming the longest branch is a simple bottleneck assumes all branches start together and the parent waits for them; engineers must account for queue times, thread pool starvation, and scheduling overhead. Misinterpreting parallel span durations can lead to misguided code optimizations that fail to resolve underlying system latency.
Conclusion on Tail Latency Observability
For the investigation proposed here, a distribution and a retained execution path answer complementary questions. The distribution describes the chosen observations in aggregate; the path can help inspect recorded work in an individual case. A team may find other evidence sufficient for a particular question, so this article does not require both signals for every diagnosis. It proposes stating what the available evidence supports, which observations are missing and what a further test would need to distinguish before a causal conclusion is reported.
A proposed measurement and coverage record
Before running the synthetic workload, this article proposes a compact measurement record with a precise start event, end event and request population. The record would state whether cancelled requests, failed requests and requests still in progress are counted. It would also identify the aggregation window, histogram representation and deployment configuration. Two dashboards labelled latency may disagree because those definitions differ. A reviewer should resolve that definitional difference before interpreting a percentile change as a change in application behavior. This is a proposed research artifact, not an OpenTelemetry requirement or an existing GPIRL instrument.
The same record would separate a workload failure from an observation failure. If a synthetic request finishes but its trace is missing, the study would preserve the completion evidence and investigate the collection path. If a request never reaches the chosen end event, a completed-request histogram alone may omit the case entirely. A later analysis should report those limits beside its timing results and avoid extending findings to unrepresented request classes. No dataset or measured result accompanies this proposal; the value of the record is that it defines what a future investigation would have to establish.
Official background videos
External publisher context. These recordings do not demonstrate GPIRL products or validate the proposed designs.
- What is OTel? | OTel for Beginners - The JavaScript Journey
Official project overview of telemetry, instrumentation and backend boundaries, in a JavaScript beginners series. Context for reading traces and metrics; it is not evidence of a GPIRL performance gain, a global percentile calculation or complete causal coverage.
Sources and further reading
- [S1] OpenTelemetry: Traces
- [S2] OpenTelemetry: Metrics
- [S3] Google SRE: Monitoring Distributed Systems
References do not imply product certification or endorsement.
Have a related operational question? Start with one slow workflow and a precise definition of the latency being measured.